数人云测试报告
通过阅读本章您可以对数人云的性能有一个大致了解
测试报告
高并发,大 qps 测试
首先,数人云网络架构需要硬负载(譬如F5)与软负载(Haproxy)结合使用。 数人会根据流量预估来提前铺设(可自动或手动)多个HAproxy实例及相应的业务层实例。
接下来,当请求到达时,硬负载首先将请求均衡到后面的某个HAproxy上,然后,HAproxy再把相应的请求负载均衡转到它后面的业务层实例上。这其中的Haproxy 与 业务层实例都可以横向扩展。
下面是不考虑硬负载性能的情况下, 对数人云(Mesos)及 Haproxy 的测试结果:
Mesos 集群性能测试
铺设的实验环境,Mesos 集群在
- 3 个 master 节点
- 500 台虚拟机
- ubuntu 14.04 x86 * 2核4G
前提下, 经测试可以承载10000个 docker 容器(nginx)。
数人云网关节点(HAproxy)的性能测试
官网发布的物理机上的测试结果
10G的网络,8KB的测试包,HAproxy 单进程每秒能处理 2万5千个请求
参考链接: HAproxy官网10G Nic 测试
数人云 OCP 物理机百万压测结果
Haproxy 配置: 10G网网络、2.20赫兹主频*48核 超线程、 内存 128g
测试报告: OCP百万并发测试结果
ucloud 云主机上的测试结果
- 承载云主机的物理机:未知
- 网卡:未知
- 虚拟机
- 2vcpu
- 4G mem
- ubuntu 14.04 64位
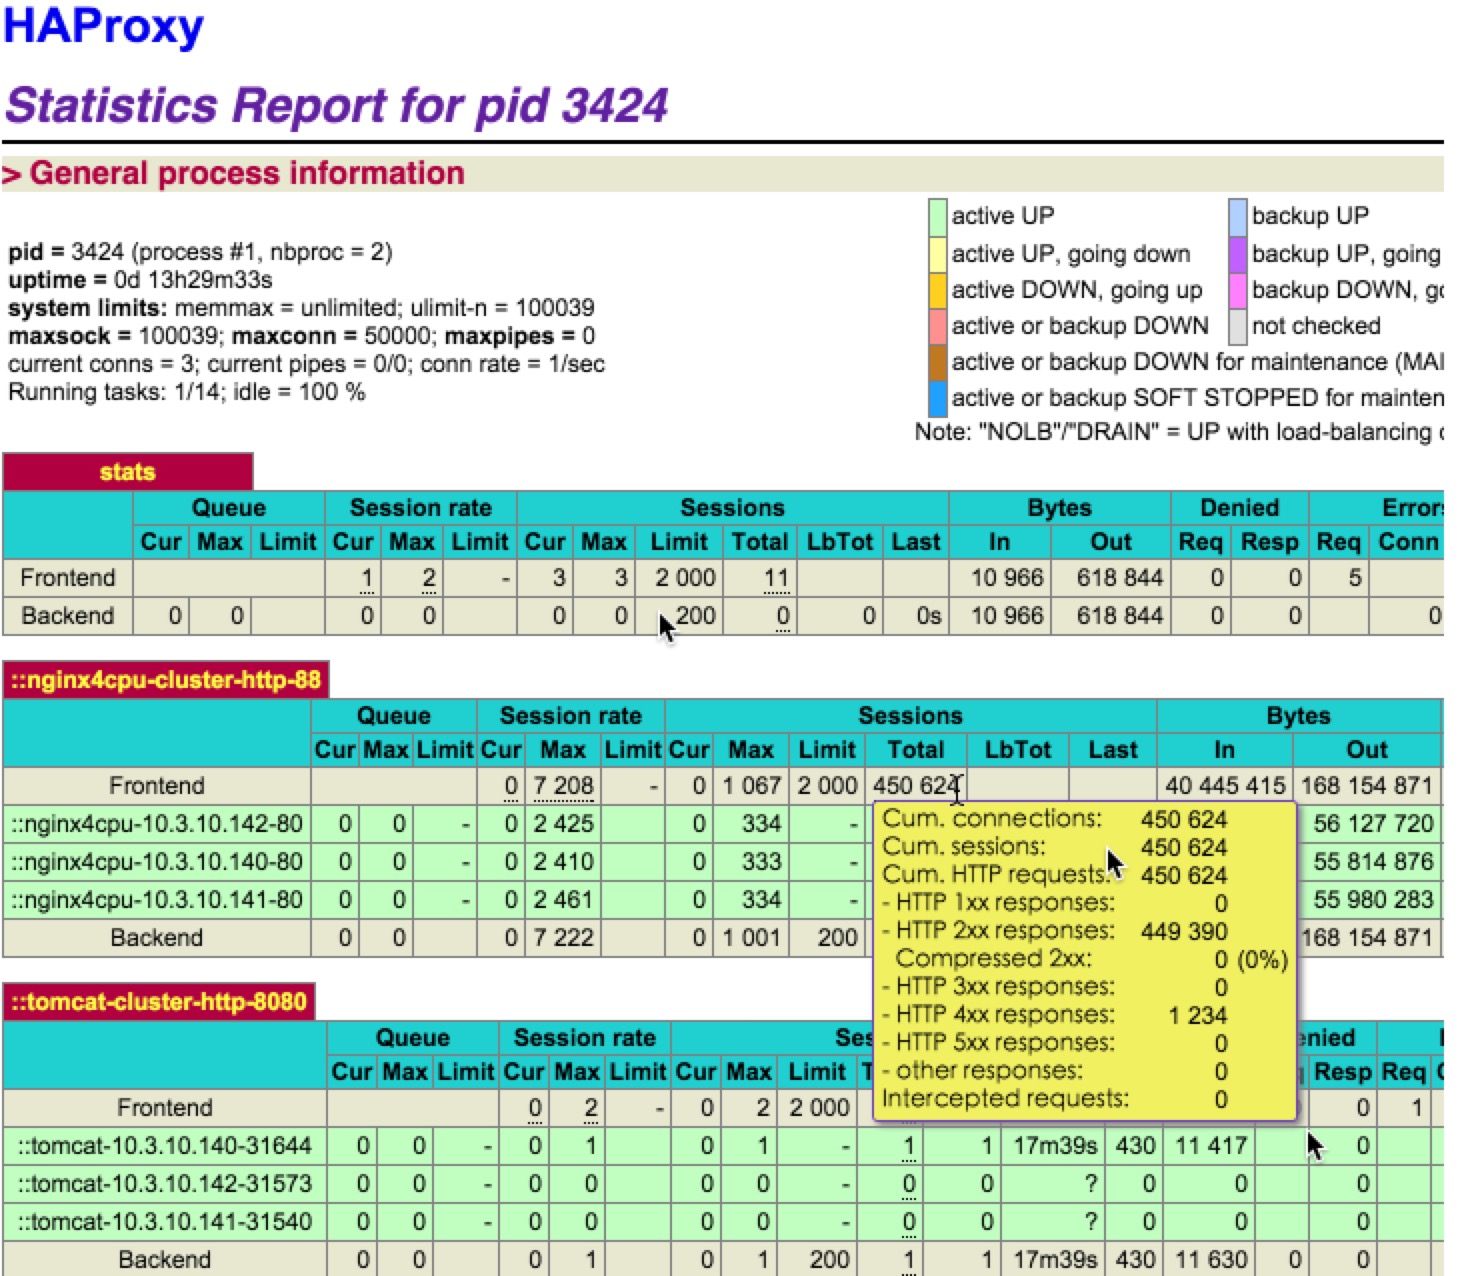
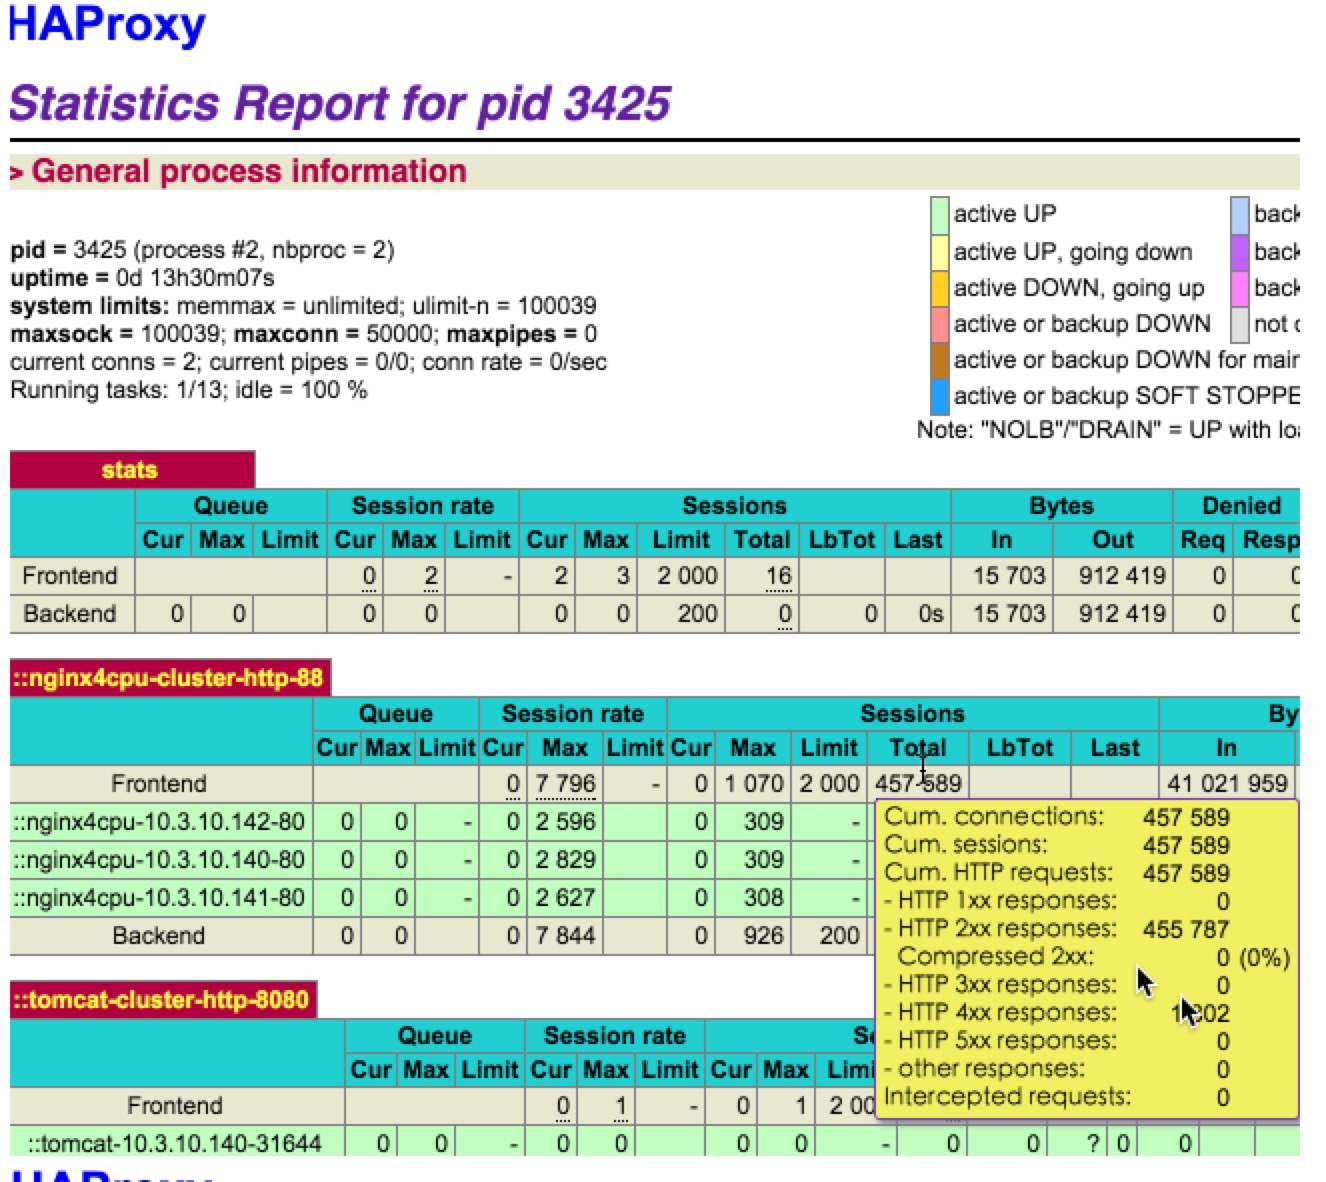
测试架构:
apache benchmark -> HAproxy -> 3 个 Nginx实例
测试1
传输 128字节,使用apache benchmark 进行测试, HAProxy 负载均衡到后面3个实例,它大约能承载每秒 2000 个并发, 11000个请求。另外,cpu使用率高于 90%, 内存使用率低于 300M。
root# ab -n 100000 -c 1500 http://10.3.10.138:88/128.html
This is ApacheBench, Version 2.3 <$Revision: 1528965 $>
Copyright 1996 Adam Twiss, Zeus Technology Ltd, http://www.zeustech.net/
Licensed to The Apache Software Foundation, http://www.apache.org/

Benchmarking 10.3.10.138 (be patient)
Completed 10000 requests
Completed 20000 requests
Completed 30000 requests
Completed 40000 requests
Completed 50000 requests
Completed 60000 requests
Completed 70000 requests
Completed 80000 requests
Completed 90000 requests
Completed 100000 requests
Finished 100000 requests

Server Software:        nginx/1.8.0
Server Hostname:        10.3.10.138
Server Port:            88

Document Path:          /128.html
Document Length:        128 bytes

Concurrency Level:      1500
Time taken for tests:   8.756 seconds
Complete requests:      100000
Failed requests:        0
Total transferred:      44000000 bytes
HTML transferred:       12800000 bytes
Requests per second:    11420.69 [#/sec] (mean)
Time per request:       131.341 [ms] (mean)
Time per request:       0.088 [ms] (mean, across all concurrent requests)
Transfer rate:          4907.33 [Kbytes/sec] received

Connection Times (ms)
              min  mean[+/-sd] median   max
Connect:        0   35  43.5     34    1081
Processing:    11   96  55.8     90    1169
Waiting:       11   82  55.8     75    1143
Total:         51  130  66.9    127    1179

Percentage of the requests served within a certain time (ms)
  50%    127
  66%    134
  75%    137
  80%    140
  90%    151
  95%    161
  98%    182
  99%    227
 100%   1179 (longest request)
测试2
传输256字节, 使用apache benchmark 进行测试, HAProxy 负载均衡到后面3个实例,它大约能承载每秒 2000 个并发, 11000个请求。另外,cpu使用率高于 90%, 内存使用率低于 350M。
root# ab -n 100000 -c 1500 http://10.3.10.138:88/256.html
This is ApacheBench, Version 2.3 <$Revision: 1528965 $>
Copyright 1996 Adam Twiss, Zeus Technology Ltd, http://www.zeustech.net/
Licensed to The Apache Software Foundation, http://www.apache.org/

Benchmarking 10.3.10.138 (be patient)
Completed 10000 requests
Completed 20000 requests
Completed 30000 requests
Completed 40000 requests
Completed 50000 requests
Completed 60000 requests
Completed 70000 requests
Completed 80000 requests
Completed 90000 requests
Completed 100000 requests
Finished 100000 requests


Server Software:        nginx/1.8.0
Server Hostname:        10.3.10.138
Server Port:            88

Document Path:          /256.html
Document Length:        256 bytes

Concurrency Level:      1500
Time taken for tests:   8.945 seconds
Complete requests:      100000
Failed requests:        0
Total transferred:      56900000 bytes
HTML transferred:       25600000 bytes
Requests per second:    11179.86 [#/sec] (mean)
Time per request:       134.170 [ms] (mean)
Time per request:       0.089 [ms] (mean, across all concurrent requests)
Transfer rate:          6212.25 [Kbytes/sec] received

Connection Times (ms)
              min  mean[+/-sd] median   max
Connect:        0   40  57.5     40    1037
Processing:     4   89  83.1     82    1129
Waiting:        4   75  83.2     66    1119
Total:         38  130  98.4    124    1149

Percentage of the requests served within a certain time (ms)
  50%    124
  66%    131
  75%    134
  80%    136
  90%    144
  95%    153
  98%    179
  99%    287
 100%   1149 (longest request)